
Wharton/Tsinghua Chinese Residential Land Price Indexes (CRLPI)
Updated to the Fourth Quarter of 2017 (2017q4)
University of Wisconsin
Tsinghua University
The Wharton School
University of Pennsylvania
The Wharton/Tsinghua Chinese Residential Land Price Indexes (CRLPI) reports series of real constant quality land prices across 35 major markets in China. See our white paper below for more information on the underlying data and technical issues involved in the creation of the index.
Figure 1’s plot of the aggregate index of the 35 cities shows that Chinese land markets fell by 8% in the last quarter of 2017, taking values back to their 2017(2) levels. This still leaves the CRLPI up over the past twelve months, with the index 22% higher than its value in the fourth quarter of 2016. Whether the last three quarters are the start of a new trend of much lower real land price appreciation in China’s major cities bears close watching. Transactions volumes have fully recovered from their sharp drop earlier in the year, as Figure 2 documents. They are now up slightly from their 400+ parcel level seen at the end of 2016.
Figure 3 shows that regional variation remains wide, with cities in the East outperforming those in the rest of the country since 2013-2014. However, the second half of 2017 saw a substantial recovery in the land markets of the West (+34%), while those in the Central region fell by 9%. Cities in the previously high appreciation East region also declined modestly on average by about 4% in the second half of the year.
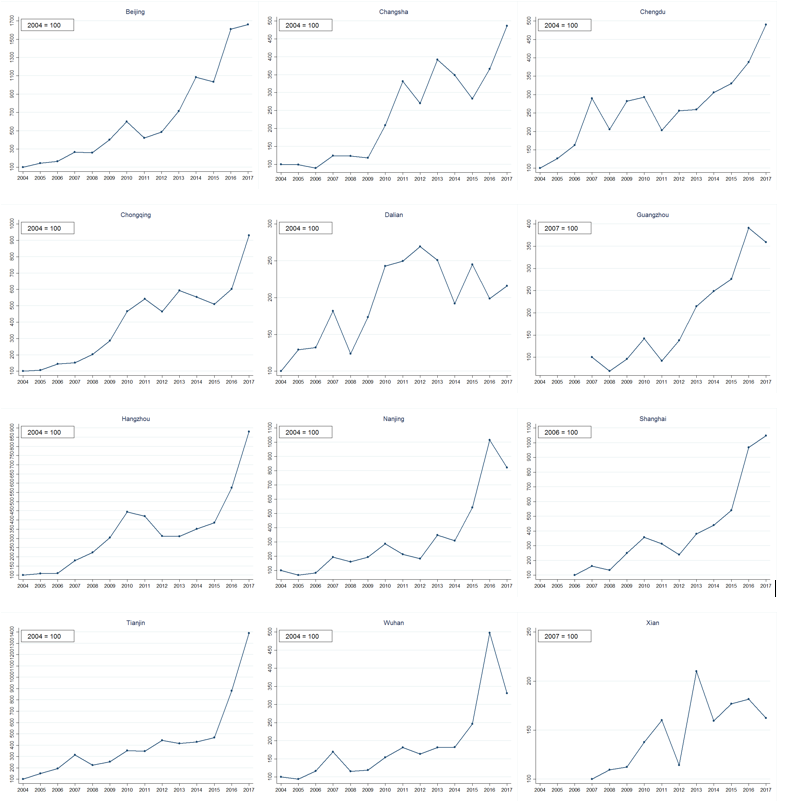
Individual city plots for twelve large cities over the past calendar year further highlight the wide variation in performance across certain markets. Real land price appreciation slowed appreciably in Beijing and Shanghai in 2017, while prices in Changsha, Chengdu, Chongqing, Hangzhou, and Tianjin grew sharply over the past year. Real prices fell in Guangzhou, Nanjing, Wuhan and Xian, while they remained flat in Dalian.
We report land price indexes for a dozen large cities on an annual basis. Those indexes will be updated at the end of the year.
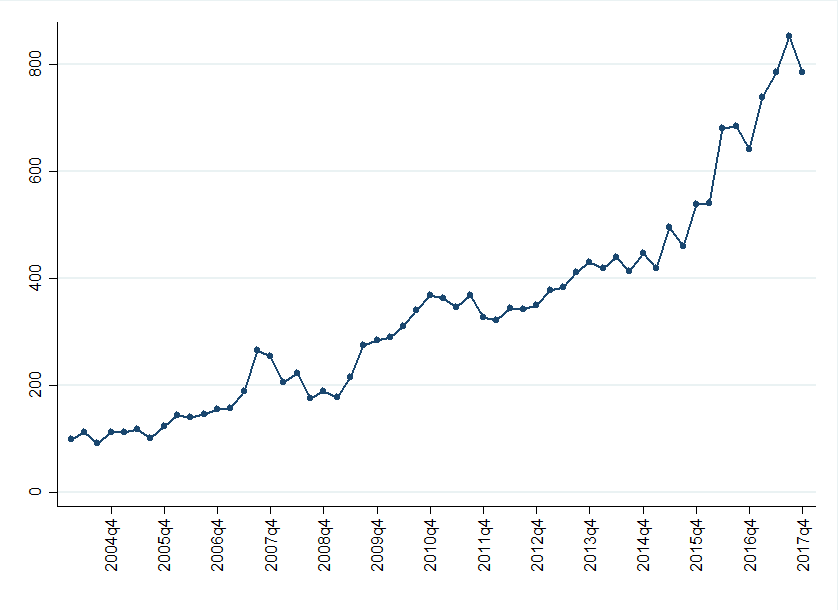
35 Markets, Constant Quality Series
(Quarterly: 2004q1 – 2017q4)
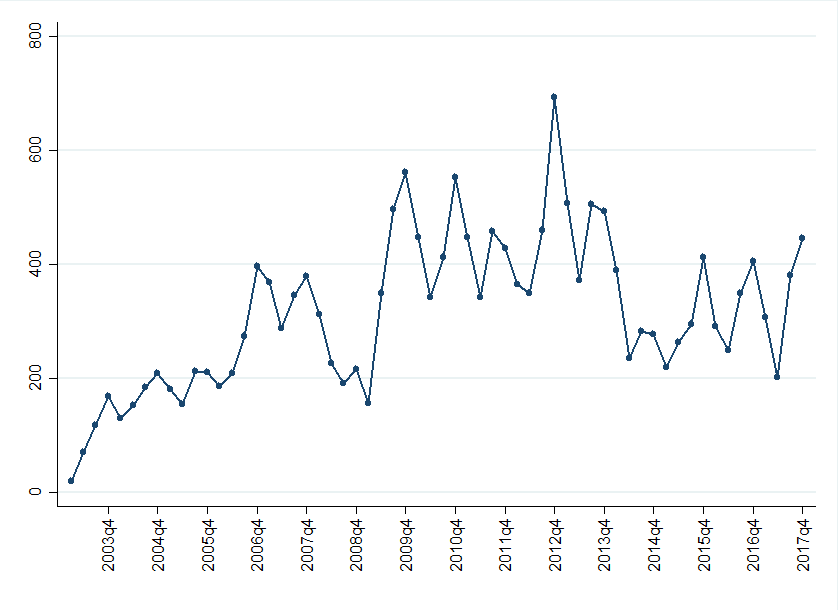
35 Markets (Quarterly: 2003q1 – 2017q4)
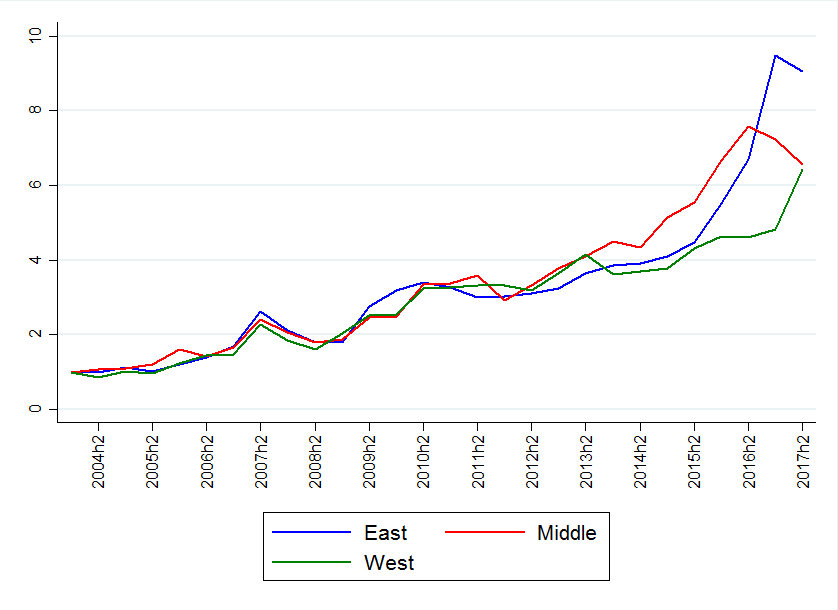
East, Middle and West Regions, Constant Quality Series
(Semi-annually: 2004h1 – 2017h2)
(Annually: 2004-2017)
| Table 1: National Price Index Growth (35 City Aggregate) 2004(1)-2017(4) 56 quarters |
|
|---|---|
| Total Appreciation | 685% |
| Compound Quarterly Growth Rate | 3.82% |
| Annualized Compound Quarterly Rate | 16.17% |
| Table 2: Regional Price Index Growth 2004h1-2017h2 28 half years |
|||
|---|---|---|---|
| East | Middle | West | |
| Total Appreciation | 805% | 556% | 543% |
| Compound Semi-Annually Growth Rate | 8.50% | 7.21% | 7.14% |
| Annualized Compound Semi-Annually Rate | 17.72% | 14.95% | 14.79% |
| Table 3: City Price Index Growth | ||||||||||||
|---|---|---|---|---|---|---|---|---|---|---|---|---|
| 2004-2017
14 years |
2006-2017
11 years |
2007-2017
11 years |
||||||||||
| Beijing | Changsha | Chengdu | Chongqing | Dalian | Hangzhou | Nanjing | Tianjin | Wuhan | Shanghai | Guangzhou | Xian | |
| Total Appreciation | 1559% | 386% | 390% | 831% | 116% | 780% | 723% | 1289% | 231% | 948% | 259% | 62% |
| Compound Annual Growth Rate | 24.12% | 12.94% | 13.01% | 18.72% | 6.10% | 18.21% | 17.60% | 22.43% | 9.65% | 22.81% | 13.64% | 4.96% |
Note: The Compound Quarterly Growth Rate (CQGR) is calculated by the formula CQGR(Ta,Tb)=(V(Tb)/V(Ta))^(1/Tb-Ta)-1 where V (Ta) is the starting value, V (Tb) is the finishing value, and Tb-Ta is the number of quarters, with Ta=1 by definition.
Download Paper: The Wharton/Tsinghua Chinese Residential Land Price Indexes (CRLPI)
Download Data File: Wharton/Tsinghua Chinese Residential Land Price Indexes Data
Any publication using the Wharton/Tsinghua Chinese Residential Land Price Index Data should include the following citation reference: